The documentation you are viewing is for Dapr v1.15 which is an older version of Dapr. For up-to-date documentation, see the latest version.
Using OpenTelemetry Collector to collect traces to send to App Insights
Dapr integrates with OpenTelemetry (OTEL) Collector using the OpenTelemetry protocol (OTLP). This guide walks through an example using Dapr to push traces to Azure Application Insights, using the OpenTelemetry Collector.
Prerequisites
- Install Dapr on Kubernetes
- Create an Application Insights resource and make note of your Application Insights connection string.
Set up OTEL Collector to push to your App Insights instance
To push traces to your Application Insights instance, install the OpenTelemetry Collector on your Kubernetes cluster.
-
Download and inspect the
open-telemetry-collector-appinsights.yamlfile. -
Replace the
<CONNECTION_STRING>placeholder with your App Insights connection string. -
Deploy the OpenTelemetry Collector into the same namespace where your Dapr-enabled applications are running:
kubectl apply -f open-telemetry-collector-appinsights.yaml
Set up Dapr to send traces to the OpenTelemetry Collector
Create a Dapr configuration file to enable tracing and send traces to the OpenTelemetry Collector via OTLP.
-
Download and inspect the
collector-config-otel.yaml. Update thenamespaceandotel.endpointAddressvalues to align with the namespace where your Dapr-enabled applications and OpenTelemetry Collector are deployed. -
Apply the configuration with:
kubectl apply -f collector-config-otel.yaml
Deploy your app with tracing
Apply the tracing configuration by adding a dapr.io/config annotation to the Dapr applications that you want to include in distributed tracing, as shown in the following example:
apiVersion: apps/v1
kind: Deployment
metadata:
  ...
spec:
  ...
  template:
    metadata:
      ...
      annotations:
        dapr.io/enabled: "true"
        dapr.io/app-id: "MyApp"
        dapr.io/app-port: "8080"
        dapr.io/config: "tracing"
Note
If you are using one of the Dapr tutorials, such as distributed calculator, you will need to update theappconfig configuration to tracing.
You can register multiple tracing exporters at the same time, and the tracing logs are forwarded to all registered exporters.
That’s it! There’s no need to include any SDKs or instrument your application code. Dapr automatically handles the distributed tracing for you.
View traces
Deploy and run some applications. After a few minutes, you should see tracing logs appearing in your App Insights resource. You can also use the Application Map to examine the topology of your services, as shown below:
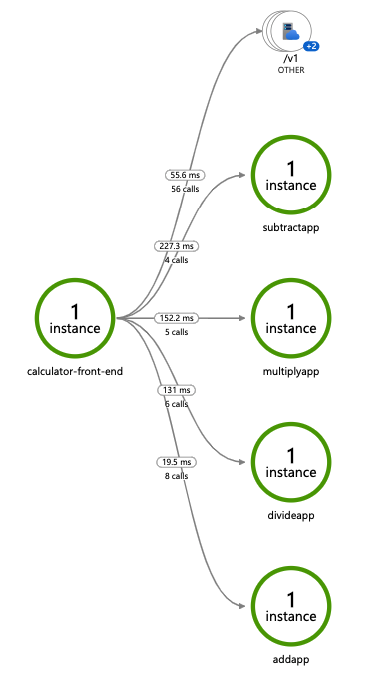
Note
Only operations going through Dapr API exposed by Dapr sidecar (for example, service invocation or event publishing) are displayed in Application Map topology.Related links
- Try out the observability quickstart
- Learn how to set tracing configuration options
Feedback
Was this page helpful?
Glad to hear it! Please tell us how we can improve.
Sorry to hear that. Please tell us how we can improve.